
Welcome to the first article of Pentest IoT 101. UART is a primary entry point on most embedded boards: often the first available access and the one that yields the greatest impact. This article covers UART from all angles and aims to guide you step by step — from the multimeter to obtaining a root shell when possible.
Aware that every board has its specifics, this publication is part of a series: short follow‑up articles will present alternative methods and practical techniques to obtain a console when countermeasures are in place.
UART (Universal Asynchronous Receiver/Transmitter) is a widely used asynchronous serial protocol, especially for embedded debugging. It transports a stream of bytes from point A to point B and is frequently found in SoCs (System on Chip). On many PCBs running embedded Linux, UART is the main — sometimes the only — way to retrieve logs in production.
It is a simple protocol generally wired on three lines: TX (transmit), RX (receive) and GND (common ground).
The TX line sends bytes from the device, the RX line receives bytes destined for the device. To communicate, connections are crossed: TX of the adapter → RX of the target, RX of the adapter → TX of the target (GND provides the common reference).
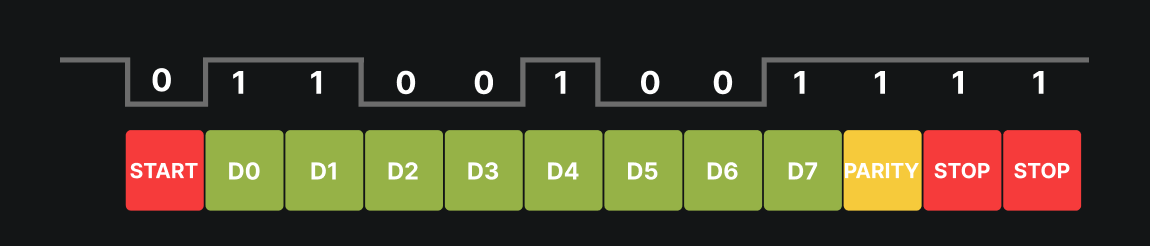
UART operates without a dedicated clock: each byte is framed by a start bit and one or more stop bits, and may include a parity bit. Synchronization is done on the edges of these bits. Essential parameters to know are baud rate (e.g., 115200, 57600, 38400, 9600), number of data bits (usually 8), parity (none/even/odd) and number of stop bits.
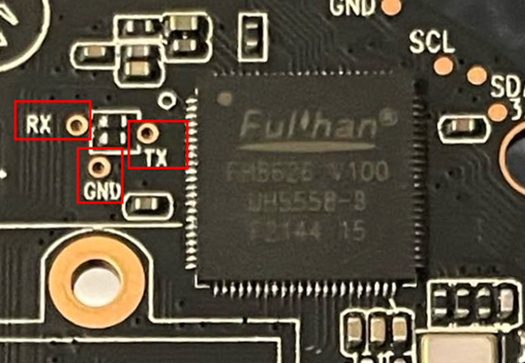
Almost every board has an accessible UART port. It is mainly used for debugging: retrieving system and application logs (boot, drivers, error messages…), and sometimes for obtaining an interactive console. For manufacturers, it’s an easy way to display the platform state. Frequently, the UART port is placed near the SoC/microcontroller to minimize interference and keep the signal clean.

In some cases, UART not only allows reading logs but also sending commands: enabling a mode, triggering an interaction, or even obtaining a shell (sometimes a U‑Boot console, sometimes a full Linux shell).
Sometimes UART pins are obvious — silk‑screened TX / RX / GND — and spotted at a glance. Other times you must probe the board like a detective: look for clues, test, and verify relentlessly. Most of the time these pins are grouped in threes, but there’s no infallible rule — practice is the only teacher.
Below are three simple and inexpensive methods to locate them and, crucially, to distinguish TX from RX.
Static analysis of the PCB is an important — sometimes unavoidable — phase. It allows precise identification of pads and traces linked to the SoC, locating pins likely to be UART ports and reducing the risk of mistakes when connecting.
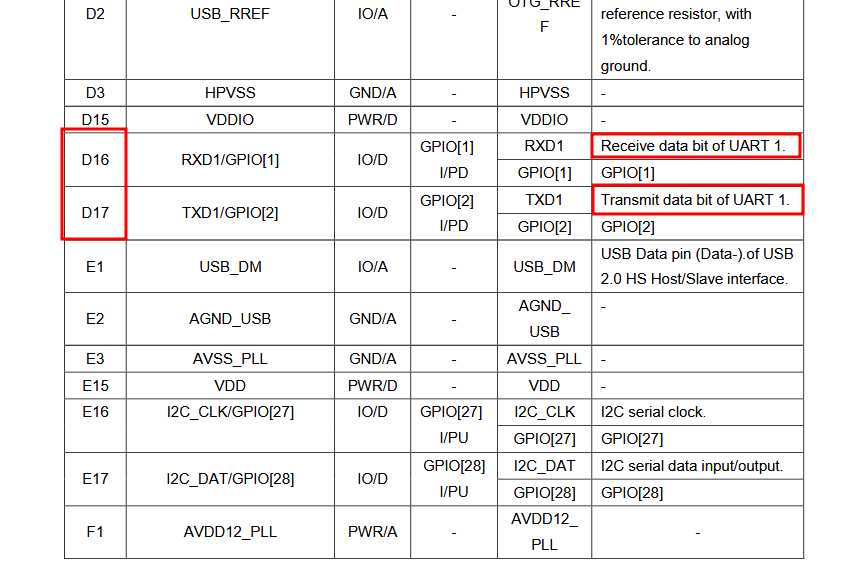
To do this, you need the datasheets of the board’s components (or, more rarely, the whole board — spoiler: almost never the case). These documents give the pin mapping and functions, which helps locate the UART resource. Once pins are identified, you can verify or trace connections with a multimeter set to continuity test to confirm the link between pads and the SoC.
It can also help to take detailed photos to virtually reconstruct the PCB. A sharp, well‑lit photo imported into an image editor lets you follow traces visually and identify interesting zones or circuits without physically manipulating the board.
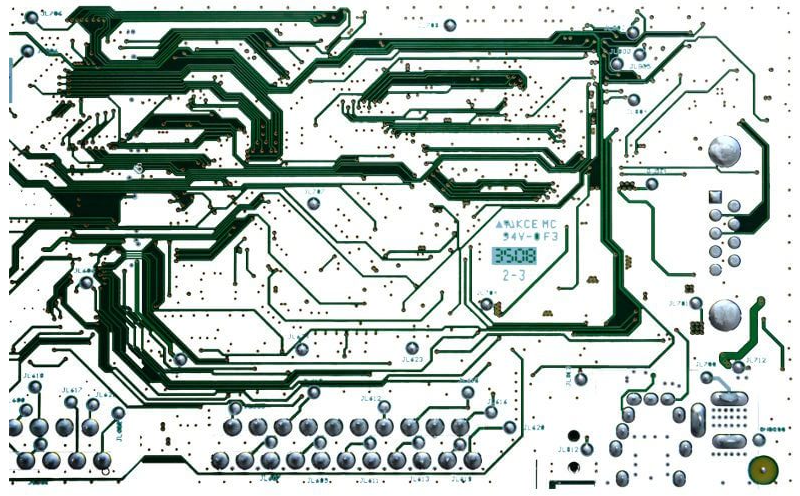
Yes, it’s long and sometimes tedious. But done well, this preparatory work strongly accelerates the next reverse‑engineering steps. On complex circuits (e.g., POS terminals) with many anti‑tamper mechanisms, it’s better to map and understand flows between CPU and flash before soldering, drilling or attempting risky manipulations.
Further reading
If PCB path reverse engineering interests you, read this article: https://www.pcb-hero.com/blogs/lickys-column/how-to-reverse-engineer-a-pcb-board-1 — it explains the steps to get clean, usable results.
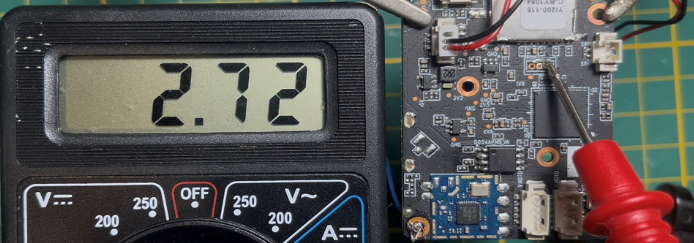
When pins are not silk‑screened or clearly identifiable, the multimeter becomes your best ally. The idea is simple: power the board and measure voltages on different pins. This often quickly reveals active UART lines.
In practice, at SoC boot, it outputs many boot logs — so the TX pin shows a voltage that oscillates between 0 V and 3.3 V (depending on logic level). You may observe an average or RMS voltage around Ueff = Um/√2, roughly 2.7 V, indicating transmission activity.
Conversely, the RX pin, waiting for input, usually remains stable (often near 0 V) since it has not yet received any signal.
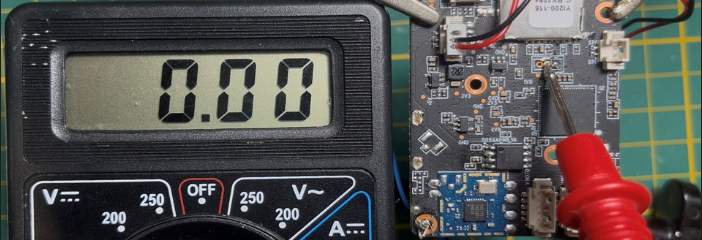
This basic method is quick and effective to differentiate UART pins. By observing electrical behavior you can identify TX (variable signal) and RX (stable) without special equipment.
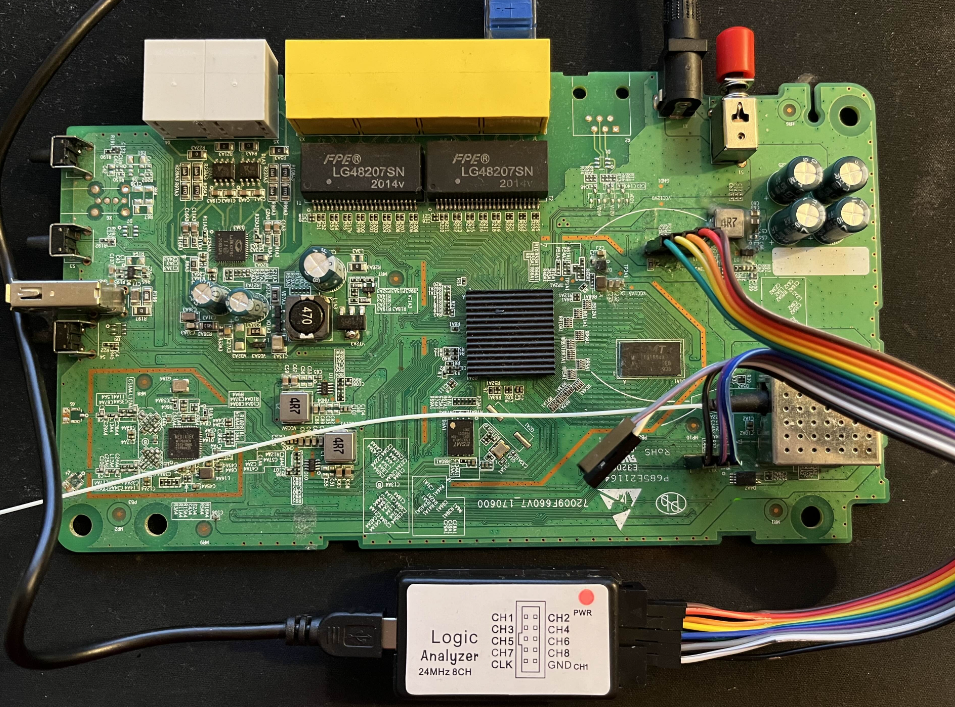
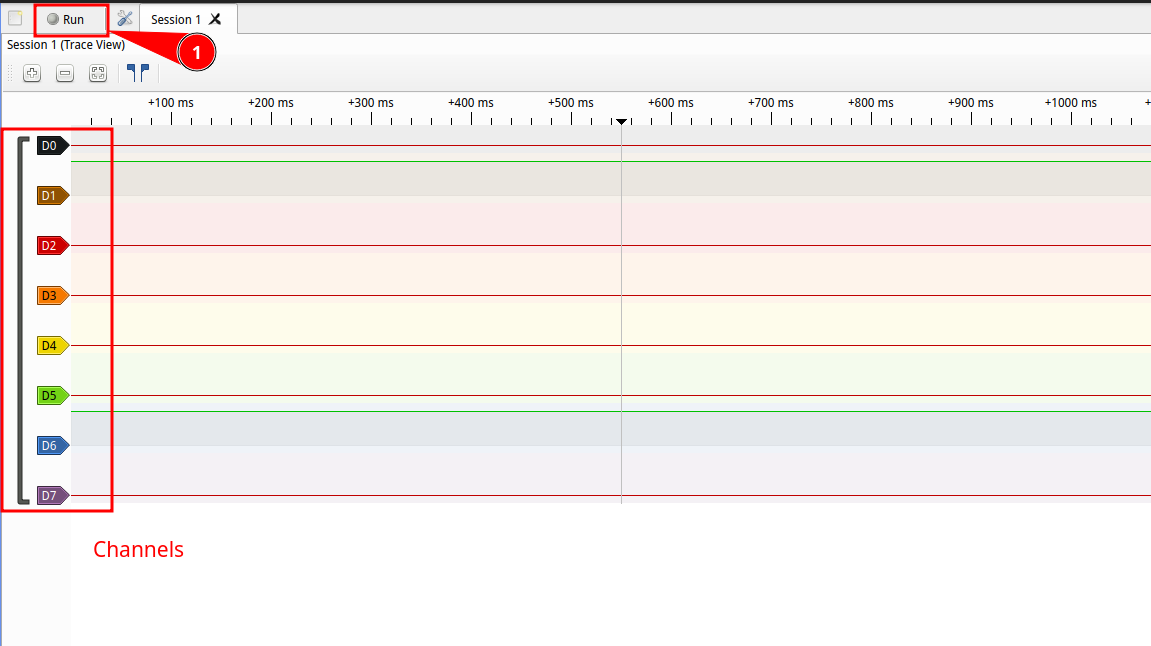
When pin identification is unclear or the multimeter is insufficient, analyze pin behavior over time with a logic analyzer. This tool captures signals on several pins simultaneously and visualizes pulses, transitions and repetitive patterns. It highlights characteristic behaviors of communication protocols like UART, SPI, I²C, etc.
There are many logic analyzers available, from compact affordable modules to high‑end professional units. I personally use a small 24 MHz 8‑channel logic analyzer for simple tasks and an LA1010 (1 000 MHz, 16 channels) when higher precision is required. Don’t buy top gear immediately: start with a model suited to your needs and upgrade if project complexity demands it.
On the software side, Sigrok is a reference. Download the AppImage, make it executable and run it: Sigrok usually detects the device automatically and configures it to capture the signal.
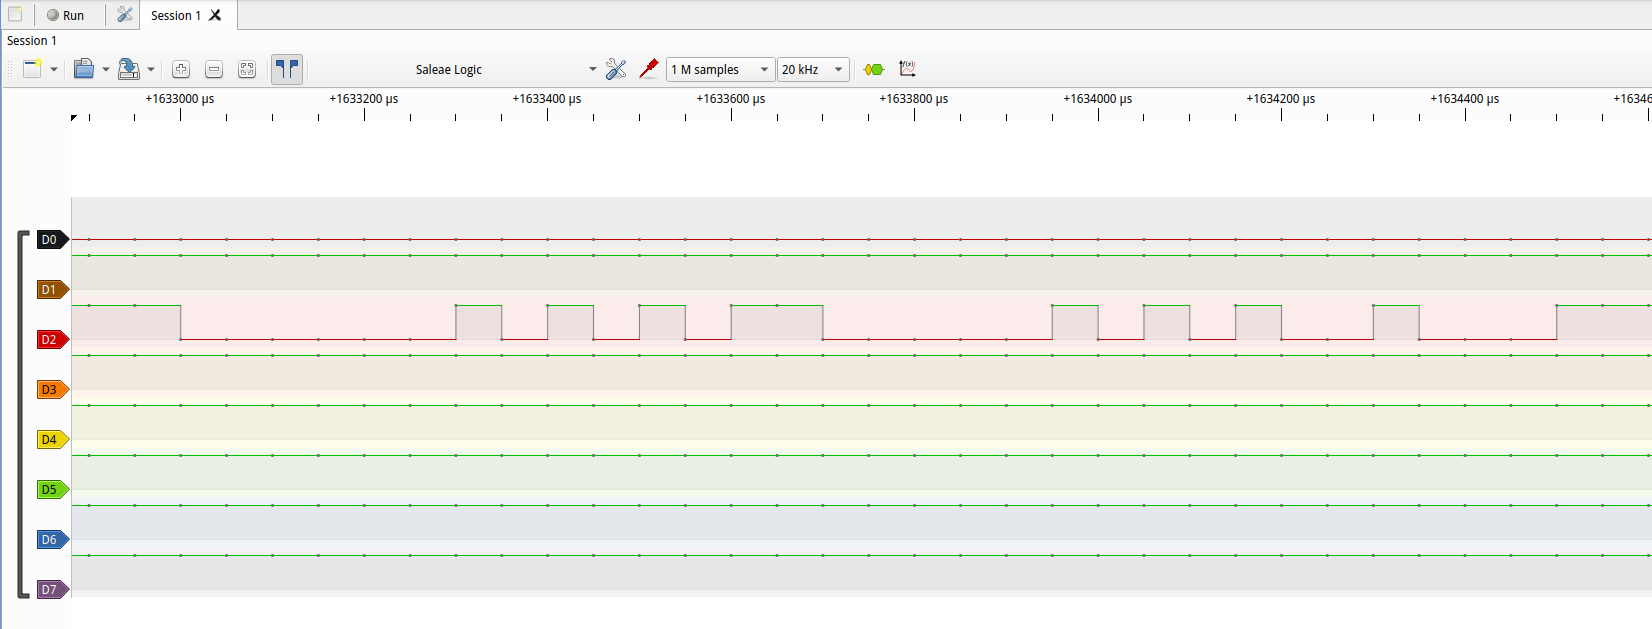
With the hardware ready, clicking “Record” produces a graph with useful information:
Graph analysis also reveals interference, anomalies or protections on the line, helping to understand flows between SoC and peripherals and securing later reverse steps.
To use UART from a modern computer, you must use a USB ↔ UART adapter. These adapters convert the PC’s USB signal to TTL serial compatible with the target board (often 3.3 V or 5 V), and vice versa. Without an adapter you cannot directly connect a PC to UART pins; connecting an RS‑232 port directly may damage the board.
In our context the adapter allows to:
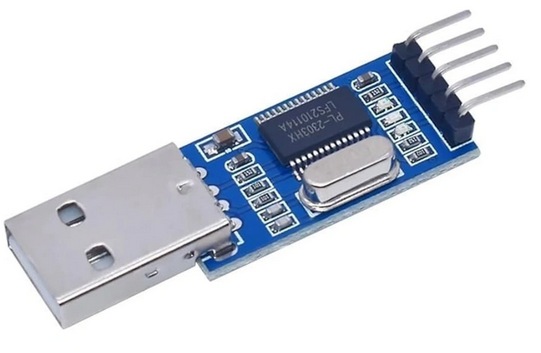 Figure 12 :
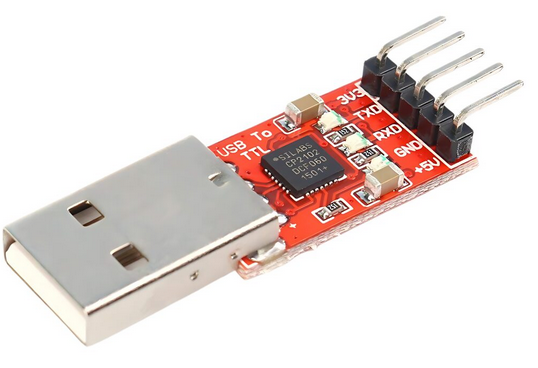 Figure 13 :
Common adapter chips include FTDI, CH340, CP2102… For beginners, a simple reliable adapter is enough. I’ve used the same model for six years that cost under €10 and it helped me make many discoveries.
Wiring is simple but must be done carefully:
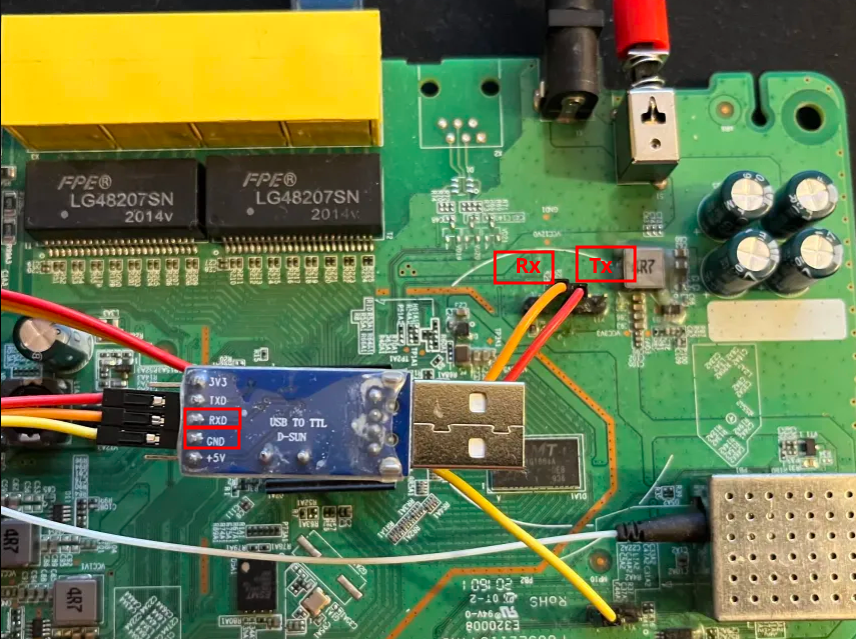
Most embedded boards expect TTL 3.3 V; applying high voltages (±12 V) can damage the target (and end the pentest :().
After wiring, select the correct baud rate and framing (often 8 bits, no parity, 1 stop bit — 8N1).
I developed a CLI tool to automate baud scanning and identify the best rate faster.
With correct parameters, logs should appear (bootloader, kernel, application messages). Depending on the target, you may see:
In most cases UART remains exploitable and provides valuable information. However, countermeasures are often present to limit access or protect sensitive data. Common protections include:
These protections don’t make exploitation impossible but require adapted methods. That’s why I cover them individually in short mini‑articles, presenting quick tips and techniques I use to bypass them and ultimately get my little root shell :D